

Waveguide Applicator
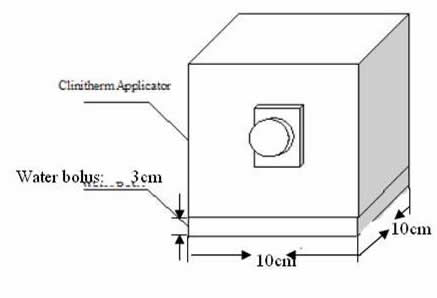
The waveguides used here are 10cm by 10cm and 10cm by 15cm rectangular waveguides working at 915MHz with the TE10 mode.
3D Human Model

The above figures shows the 3D human model simulated in the FDTD programs. Green mesh shows human body contour. Red Mesh is the possible tumor location. Both are derived from patient's CT scans. The RF applicator is illustrated in blue. In the FDTD simulation, assume the human body is surrounded in water due to the RF applicator size and microwave power penetration. The FDTD model is 13cm by 13cm by 5cm and 23cm by 18cm.
2D illustration of the simulated model

2D images of the human body. Left: image at xz plane. Right: image at yz plane. Both locate in the center of the body. The layers from bottom to top are: water, skin, tumor, fat and muscle, illustrated by different colors. The RF applicators located in water layers, 4cm away from the skin. i.e. z = -4cm
Modeling Techniques
FDTD Modeling Techniques
- Yee Cell size = 1mm
- Perfect Match Layer (PML) as the Absorbing Boundary Condition (ABC)
- Source Modeling:
- Soft source modeling for spiral antenna
- Transparent modeling for waveguide
Bio-Heat Transfer Equation (BHTE)
- Simulation result of FDTD is the electromagnetic power deposition. SAR is obtained by:

- Obtain heat distribution by the BHTE.
 where T is the temperature, p is the mass density, c is the specific heat, k is the thermal conductivity, and QEM is the heat generation rate due to the deposited EM power and is easily obtained from the SAR.
Simulation Methods for Evaluation

Simulation results for waveguide

The above figure shows the electric field locate on xz plane (top) and yz plane (bottom). Both xz and yz plane locates at the center of the simulated area. Following SAR and temperature distribution show the same location.

SAR on yz plane and xz plane

Temperature distribution on yz plane and xz plane
Run Scripts
Waveguide
- Run main_waveguide.m
- The input data: "ch2cmrot2.mat", which contains the chest model and waveguide applicator. RF applicator is waveguide, working at 915MHz;
- output is the power distribution and SAR in human body.
- SAR is shown in plot after 1000 time steps and saved in movie files.The SAR and Electric power is also saved in .mat file. It can be used later for temperature calculation.
- Run compmyall.m
- Input files: SAR of the simulated model. change the load file's name to the one generated in main_waveguide.mprogram.
- Output files: temperature rise of the object due to the SAR distribution. The final result figures include power, SAR and temperature distribution.
Bhte.c / bhte.dll (for windows)/bhte.mexglx(for Linux) is used to calculate the temperature
Results Files Instruction
- Waveguide_SAR3k.avi: the movie shows the SAR distribution in human body for the first 3000 time steps.
- Spiral_Power*.avi: the movies show the electrical power distribution in human body for the first 4500 time steps. The movies are separated into 3 files.
- Spiral_chestSARfina3k.mat: stores the accumulated SAR at 3000 timesteps caused by spiral antenna applicator as mat format. It can be the input for the temperature calculation later.
- Waveguide_chestSAR3T.mat: stores the accumulated SAR caused by waveguide applicator as mat format. It can be the input for the temperature calculation later.