


PREDICTING AQUIFER FLOW AND TRANSPORT USING A NEW SOURCE OF DATA
Shu-Guang
Li, Qun Liu, Andreanne Simard
Department
of Civil and Environmental Engineering, Michigan State University, East Lansing,
MI 48824
http://www.egr.msu.edu/igw/
The recently-developed statewide groundwater database by the Michigan Department of Environmental Quality (MDEQ), the Groundwater Inventory and Mapping Project database (GWIM), may significantly enhance our ability to characterize and model Michigan’s groundwater systems. This groundwater database would benefit us in the following situations:
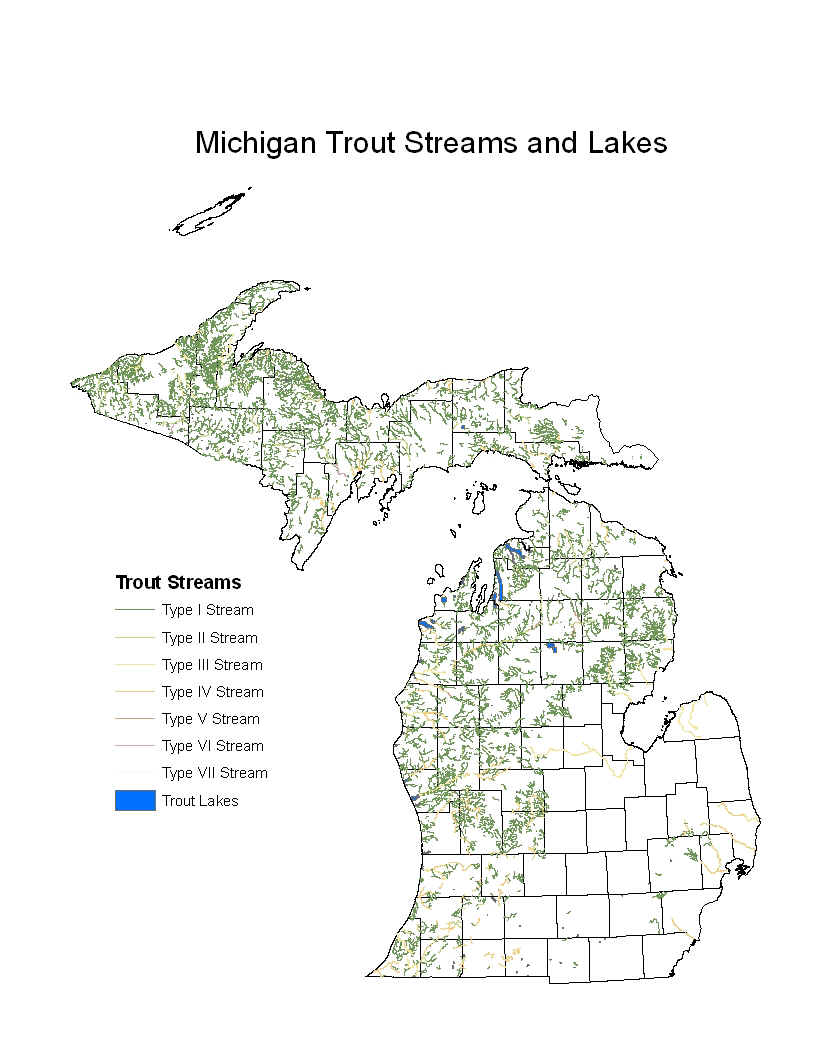
The MDEQ statewide groundwater database provides the following valuable aquifer information:
Although the statewide measurements are of lower quality that direct field measurements, they are available throughout the state in high resolution, which is displayed below.


Traditionally, the Wellogic SWL data were not always used correctly. In the past, this data was processed incorrectly (note that the SWL map obtained using the Wellogic SWL data does not make any sense showing many artificial sources and sinks) and determined to be unusable and unreliable data (see figure). According to the interpretations below, this data is not commonly used by today's scientists.
|
Livingston County, Tyrone Township |
Village of Augusta, Kalamazoo County |
|
|
|
However, our research shows that if the Wellogic SWL data is processed correctly, the Wellogic SWL maps match very well with the maps obtained from the standard water level measurements (see below). Today, we are processing the Wellogic SWL data using a geostatistical approach which allows us to take into account the data uncertainty and to also differentiate between data uncertainties made by driller error and spatial or natural variation.
Study area 1: Located in Kalamazoo County
Area = 105 mi2
On average ~ 26 pts per mi2
|
|
|
Study area 2: Tyrone Township, Livingston County
Area of 65 mi2
On average ~ 27 pts per mi2
 |
|
Study Area 3: City of Clare, Clare County
Area of 154 mi2
On average ~ 6 pts per mi2
 |
 |
The method of processing the Wellogic SWL data correctly may work well for sites with a high amount of well data, however, one may ask what would happen if researching a site with very little data. The figures below serves as an example to show that even a low data density site should provide a reasonably good SWL map for the area (see below). In this example all of the maps support the same general pattern as the map using a very high amount of data.
|
|
Another method of showing that the Wellogic SWL data is valuable source of information is by verifying if the well head protection areas (WHPAs) developed using field measurements (found in the GWIM database) align well with the direction of the Wellogic derived SWL gradient (see below). In all of the cases shown below, the WHPA is oriented correctly with respect to the groundwater flow direction.


The Wellogic SWL database can also be used to characterize large-scale temporal trends. This is shown with two example studies performed in Michigan. The first temporal analysis is performed for the City of Lansing. In this case, the groundwater withdrawal rates in the City of Lansing have increased steadily between 1910 and 1960; however, withdrawals since 1970 have been nearly constant (see the figure below). This has been confirmed with the use of the Wellogic SWL database. In the SWL maps shown below, the maximum drawdown changes with time, which is consistent with the temporal withdrawal pattern .

Groundwater withdrawal and population, Lansing, Michigan, 1910-90.

The second temporal analysis is the observed groundwater level declines from 1991 to 2003 in northern Monroe County, Michigan. These declines are consistent with increased groundwater demands in the region. Prior to 1990 the groundwater demands were met by capturing the natural discharge from the area and inducing leakage through glacial deposits that cover the bedrock aquifer. The majority of the groundwater used in this county has been attributed to quarry dewatering. The figure below represents the location of the active quarries in Monroe county along with the location of observation wells used in the study performed by the USGS to be able to measure the groundwater levels in Monroe County, Michigan.

The following figures represent the groundwater levels in Monroe County, Michigan developed using the Wellogic SWL data for that area on a temporal basis. You can see that the groundwater levels begin declining in the 1990's with a greater impact shown from 2000 to 2006.

Next Steps:
The next Steps in this project are to explore the specific capacity data and to apply the GWIM database to Groundwater modeling. The specific capacity data from the GWIM database will be obtained from the Wellogic data. Modeling using the GWIM data (lakes, streams, recharge, DEM) and Wellogic data (bedrock elevation, lithology based K) will be used to try and reproduce the Wellogic SWL map.
Acknowledgements:
Advisory Committee:
Rick Mandle
Steve Miller
Brant Fisher
Elgar Brown
Shu-Guang Li,
Ph.D., P.E.
Qun Liu, Ph.D.
Richard Mandle
Andreanne Simard
References:


